
Category: Sales

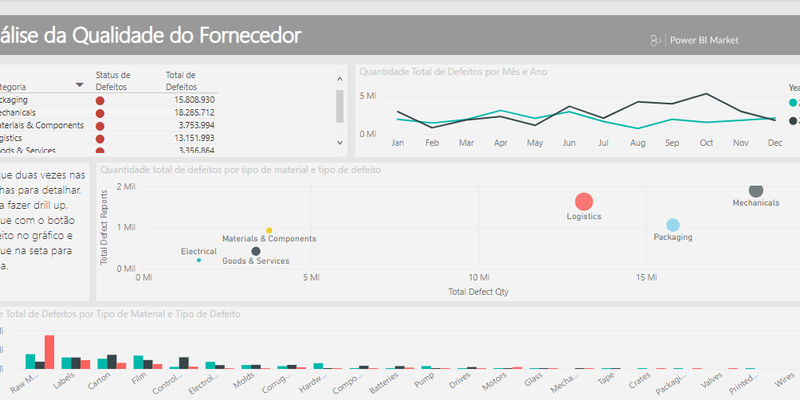
This industry sample dashboard and underlying report focus on one of the typical supply chain challenges — supplier quality analysis. Two primary metrics are at play in this analysis: total number of defects and the total downtime that these defects caused. This sample has two main objectives: Understand who the best and worst suppliers are, with respect to quality Identify which plants do a better job finding and rejecting defects, to minimize downtime
Log

Simplify management, achieve compliance, and keep data secure by giving people access to the insights they need.

Fast data shift for insights and action. Connect to hundreds of sources, prepare data with ease, and create beautiful reports in minutes.

Bring your applications to life using data. Easily insert interactive data views and generate engaging, high-fidelity reports on any device.