
Category: HR
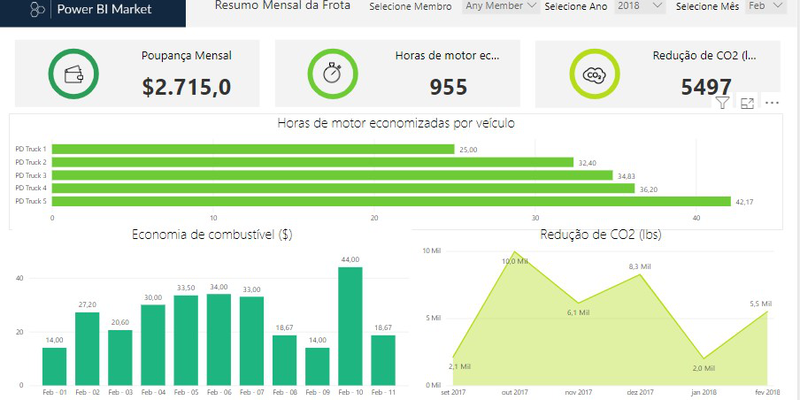
Billions of metric tons of greenhouse gases are emitted every year across the globe and the transportation sector accounts for about half of these emissions. For fleet owners, this highlights the need for fleet management analytics that can help reduce their carbon footprint. Third I developed a Monthly Fleet Summary dashboard that utilizes real-time data to enhance fleet operation and maintenance. With this Power BI report, the data sourced from the vehicles is made easily accessible to the users in the form of stunning visualizations, all in a matter of minutes. This powerful visualization empowers the fleet owners to access the insights on the move in real-time. Users can monitor vehicle health and fuel efficiency, and understand driving patterns/behavior based on the insights about CO2 emissions reduction, monthly fuel savings, engine hours saved, and more. Questions it helps answer: How many engine hours were saved by individual fleets? Has the CO2 emission reduction improved over the last 6 months? by: Thirdy, data analytics consulting.
Log

Simplify management, achieve compliance, and keep data secure by giving people access to the insights they need.

Fast data shift for insights and action. Connect to hundreds of sources, prepare data with ease, and create beautiful reports in minutes.

Bring your applications to life using data. Easily insert interactive data views and generate engaging, high-fidelity reports on any device.


